

Crime writers are asked about the states with the highest rates of violent crime, or the most dangerous states (and cities).
The chart below shows the states with the highest rates of violent crime from the Bureau of Justice Statistics (BJS) of the U.S. Department of Justice.
Crime Known to Law Enforcement, 2025 (the data used for this article) uses crime counts from the National Incident-Based Reporting System (NIBRS) compiled by the FBI.
It’s based on crimes reported to the police. Forty-eight percent of violent crimes are reported to law enforcement.
The FBI’s national crime counts reflect the primary offense only, as reported through their Summary Reporting System.
However, the NIBRS counts up to 10 crimes per criminal incident, and this article includes all crimes counted by the NIBRS, not just the primary offense (as confirmed in an email by the USDOJ).
Through the NIBRS, crime numbers are higher than the FBI’s monthly, quarterly, and yearly crime reports using the primary offense because it counts multiple crimes connected to a criminal event.
A forthcoming article will explain the numerical difference.
For example, if a criminal event included a robbery, it would count once (as the primary crime) in FBI crime statistics through their Summary Reporting System.
But many criminal events include multiple charges, and police could add an aggravated assault or a felon in possession of a firearm or a parole violation to the primary charge of robbery. NIBRS can record multiple offenses associated with a criminal incident, rather than counting only the primary offense under the FBI’s traditional reporting system, to gain a better understanding of crime.
NIBRS measures recorded, police-known offenses, not every offense committed, and its estimates depend on the completeness and representativeness of the underlying data submitted by law enforcement.
States With The Highest Violent Crime Rates Based On NIBRS Crimes Reported To Law Enforcement
Eighteen states had a violent offense rate that was significantly higher than the national rate.
Pennsylvania and Alaska are not shown. Estimates did not meet statistical reliability criteria. See Methodology.
The violent offense rate varied across states, from 638.8 violent offenses per 100,000 persons in New Mexico to 97.1 per 100,000 in Maine.
In total, 18 states had a violent offense rate that was higher than the national rate of 335.2 per 100,000.
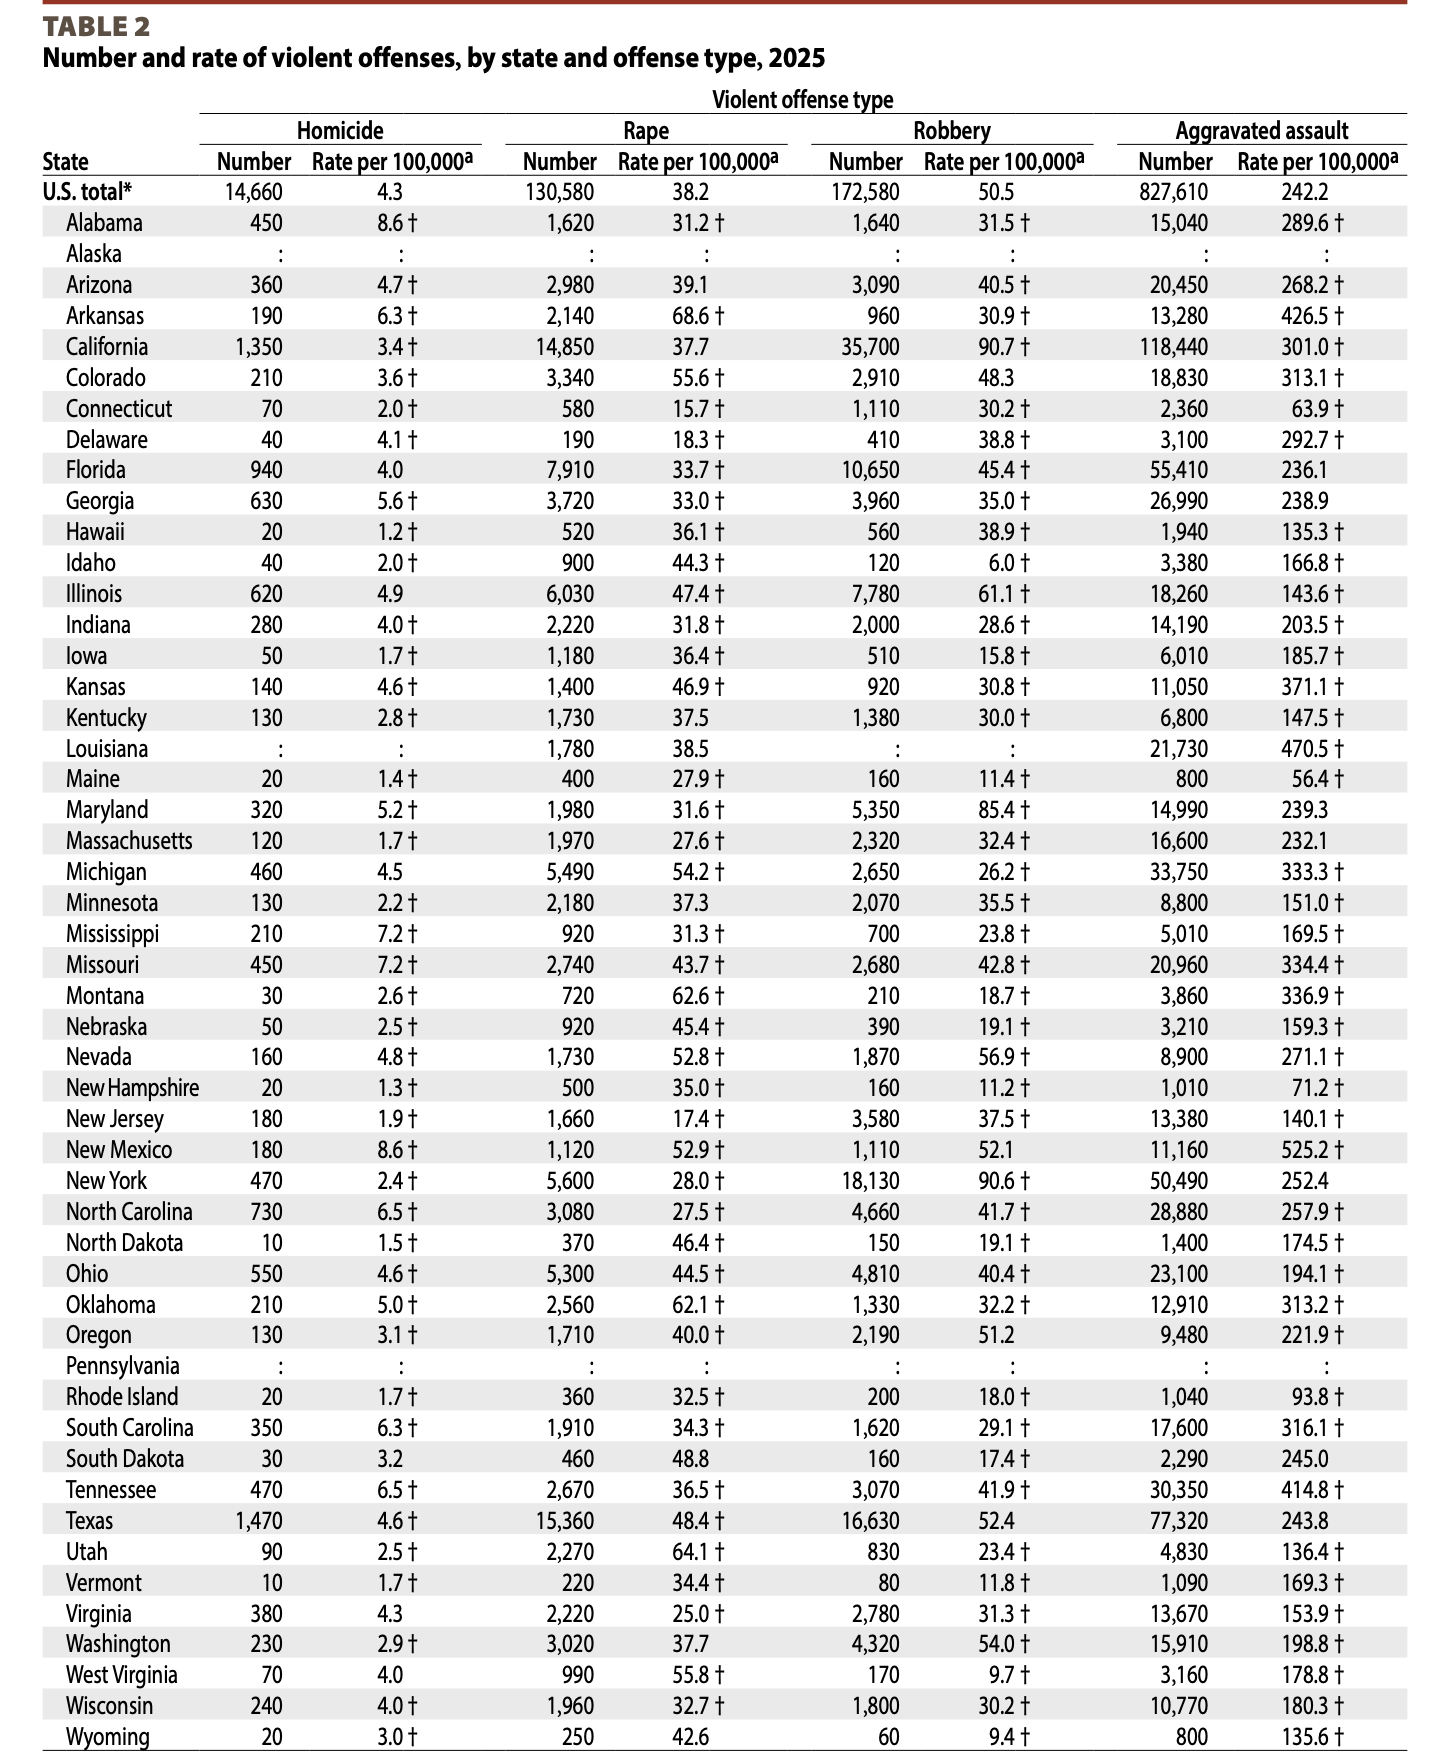
The homicide offense rate ranged from 8.6 per 100,000 in Alabama and New Mexico to 1.2 per 100,000 in Hawaii.
A total of 16 states had a homicide offense rate that was higher than the national rate of 4.3 per 100,000.
The rape offense rate ranged from 68.6 per 100,000 in Arkansas to 15.7 per 100,000 in Connecticut.
A total of 18 states had a rape offense rate that was higher than the national rate of 38.2 per 100,000.
The robbery offense rate ranged from 90.7 per 100,000 in California to 6.0 per 100,000 in Idaho. A total of six states had a robbery offense rate that was higher than the national rate of 50.5 per 100,000.
The aggravated assault offense rate ranged from 525.2 per 100,000 in New Mexico to 56.4 per 100,000 in Maine. A total of 17 states had an aggravated assault offense rate that was higher than the national rate of 242.2 per 100,000.
How Groups Are Affected
The violent victimization rate decreased from 2024 to 2025 for persons in all age groups.
In 2025, the rate of violent victimization was 323.8 per 100,000 females, a decrease from 2024 (359.8 per 100,000). The female victimization rate declined from 2024 to 2025 for each of the four violent crime types of homicide, rape, robbery, and aggravated assault.
Similarly, the rate of violent victimization of males in 2025 was 355.5 per 100,000 males, a decrease from 2024 (405.5 per 100,000). The male victimization rate also declined from 2024 to 2025 for each of the four violent crime types.
The violent victimization rate declined for white, black, and Hispanic persons from 2024 to 2025. The victimization rates for the specific offenses of homicide, rape, robbery, and aggravated assault also declined for persons in these three race groups from 2024 to 2025.
Asian individuals had a violent victimization rate of 116.4 per 100,000 in 2025, a decline from the 2024 rate (144.2 per 100,000). The 2025 victimization rates of Asian persons were lower than the 2024 rates for homicide, robbery, and aggravated assault. The rape victimization rate for Asian persons in 2025 was not statistically different from 2024.
During the same period, American Indian or Alaska Native persons did not experience statistically significant changes in their overall violent victimization rates. American Indian or Alaska Native persons experienced a decline in the rate of robbery victimizations.
Native Hawaiian or other Pacific Islanders also did not experience statistically significant changes in their overall violent victimization rates. The homicide and the robbery victimization rates declined for Native Hawaiian or other Pacific Islander individuals
Chart 1
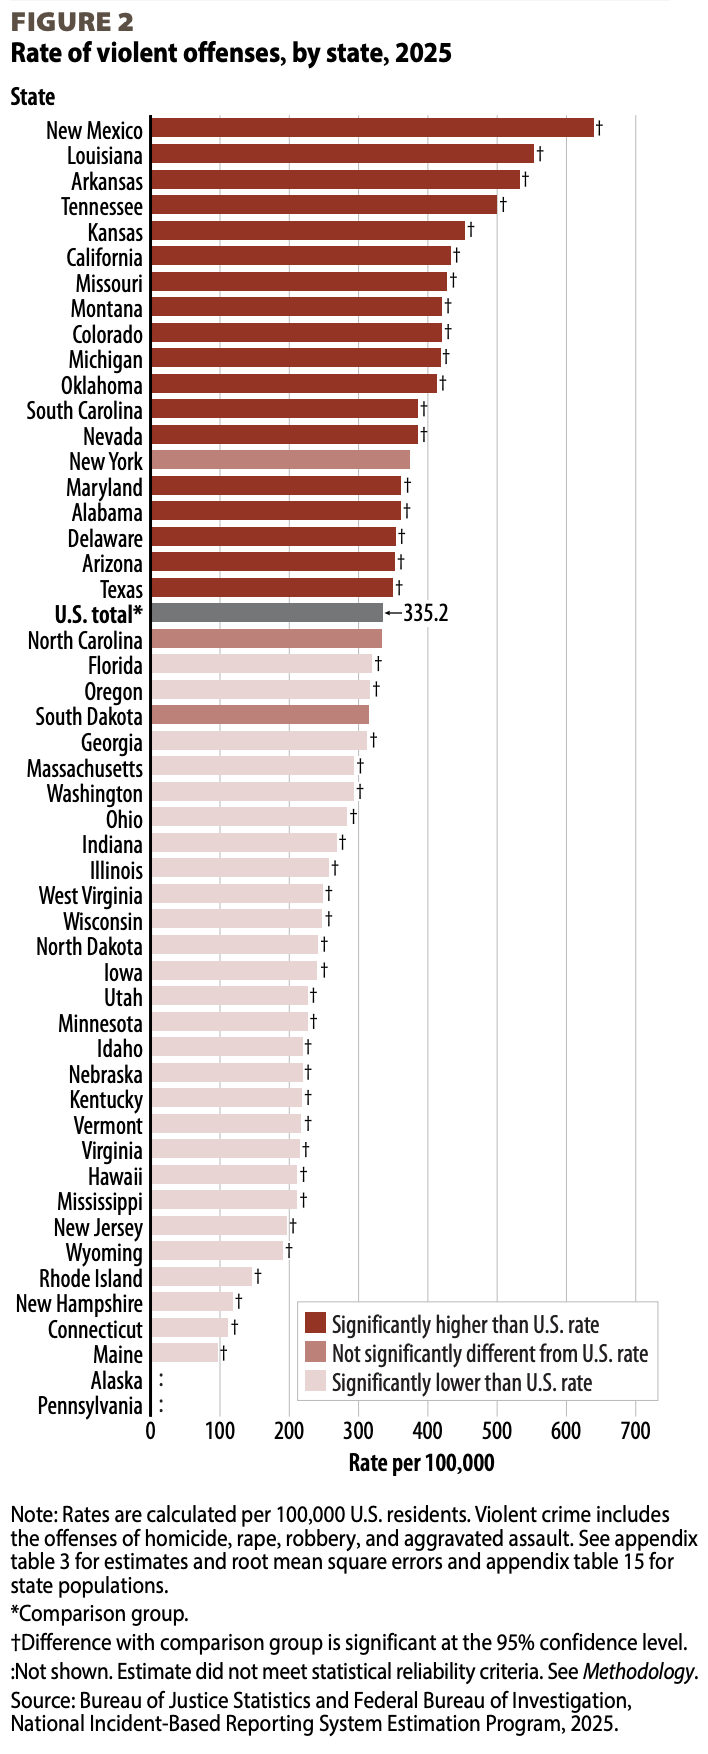
Chart 2

Comments